North Bay Real Estate Market Update – December 2024

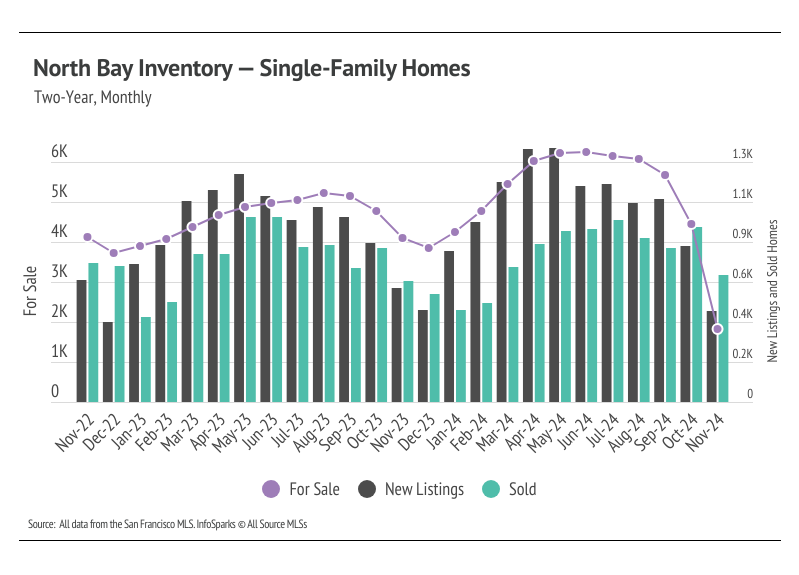
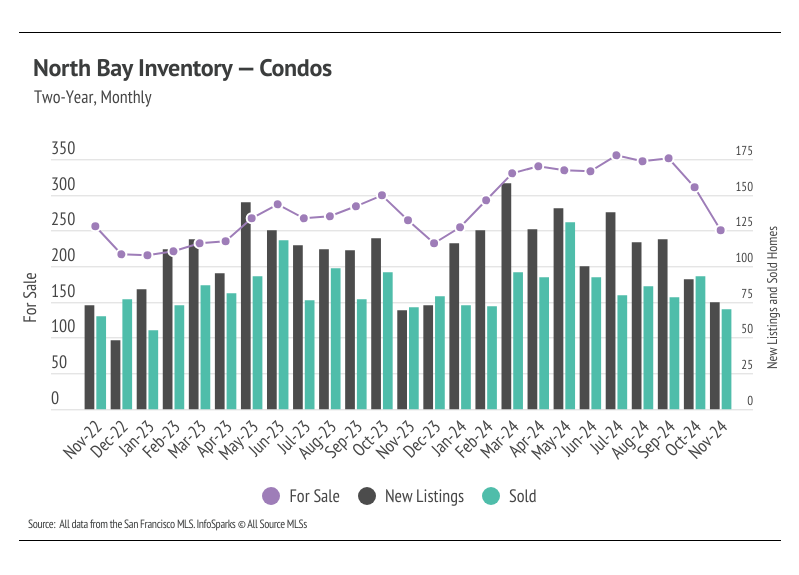
In 2024, the housing market had looked progressively healthier with each passing month. Then November happened, and inventory dropped by over 50%, more than erasing the large gains from the first half of the year. Even though sales volume this year was similar to last, far more new listings came to the market, which allowed inventory to grow significantly. Typically, inventory begins to increase in January or February, peaking in July or August before declining once again from the summer months to the winter. The precipitous fall in November was unexpected and unusual. For now, it’s possible that sellers simply took their homes off the market after seeing that interest rates would stay elevated for longer, or it’s possibly a database error from our data provider. We will dive more into this next month as more data comes out.
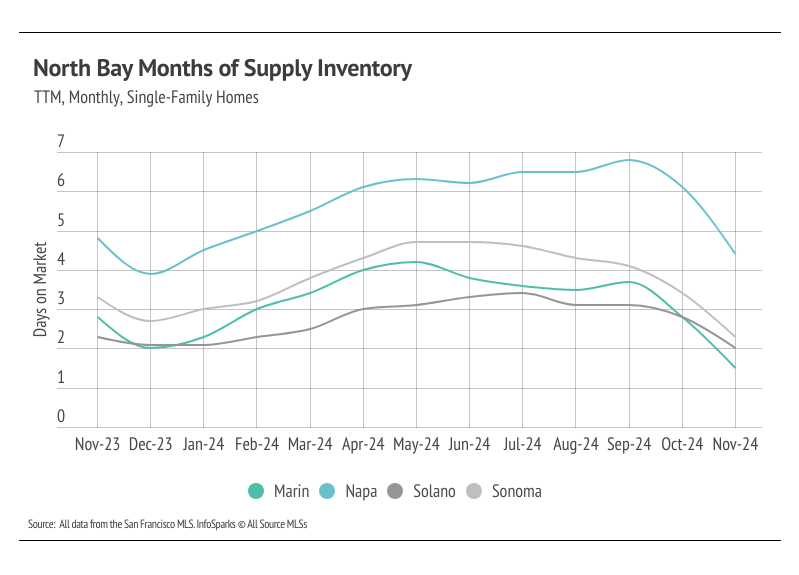
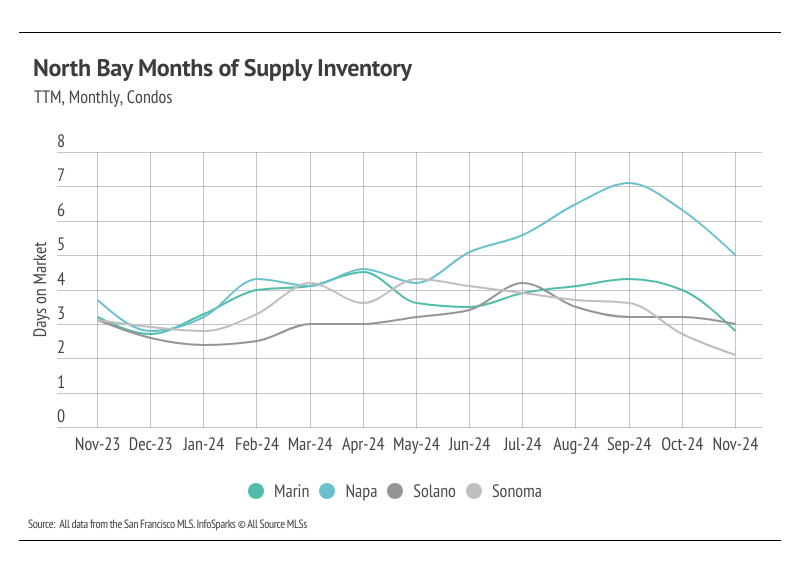
Months of Supply Inventory (MSI) quantifies the supply/demand relationship by measuring how many months it would take for all current homes listed on the market to sell at the current rate of sales. The long-term average MSI is around three months in California, which indicates a balanced market. An MSI lower than three indicates that there are more buyers than sellers on the market (meaning it’s a sellers’ market), while a higher MSI indicates there are more sellers than buyers (meaning it’s a buyers’ market). MSI in the North Bay markets trended higher throughout most of 2024. However, in October and November, MSI fell across markets, implying the market shifted more favorably toward sellers. Currently, single-family home MSI indicates a sellers’ market in Marin, Solano, and Sonoma and a buyers’ market in Napa.
Stay up to date on the latest real estate trends.








You’ve got questions and we can’t wait to answer them.