North Bay Monthly Newsletter – January 2020
Real Estate

Real Estate
Welcome to our January newsletter. This month, we cover the state of employment in the United States and the likelihood of meaningful stimulus. We also dive into how the Democratic Party’s majority control over both chambers of Congress and the White House could affect asset prices and interest rates.
Most of California (around 98% by population) is under a stay-at-home order due to COVID-19, and the United States as a whole is seeing new peaks every day. With the approval of several vaccines, we finally have a glimmer of hope to move out of the pandemic. However, we know that transmission mitigation measures will still be necessary through 2021 at least. The pandemic has substantially raised demand for housing, and we suspect that demand will continue through this year. Mortgage rates remain at all-time lows, and buyers are devoting more of their total spending to housing costs.
As we enter the new year, we continue to provide you with the most up-to-date market information so that you feel supported and informed in your buying and selling decisions.
In this month’s newsletter, we cover the following:
Key Topics and Trends in January
According to the ADP private payrolls, the U.S. lost 123,000 jobs in December 2020, marking the first contraction since April. Economists predicted an increase of around 60,000 jobs in December. However, they did not anticipate larger companies, especially in leisure and hospitality, laying off employees due to reimplementation of stricter COVID-19 restrictions.
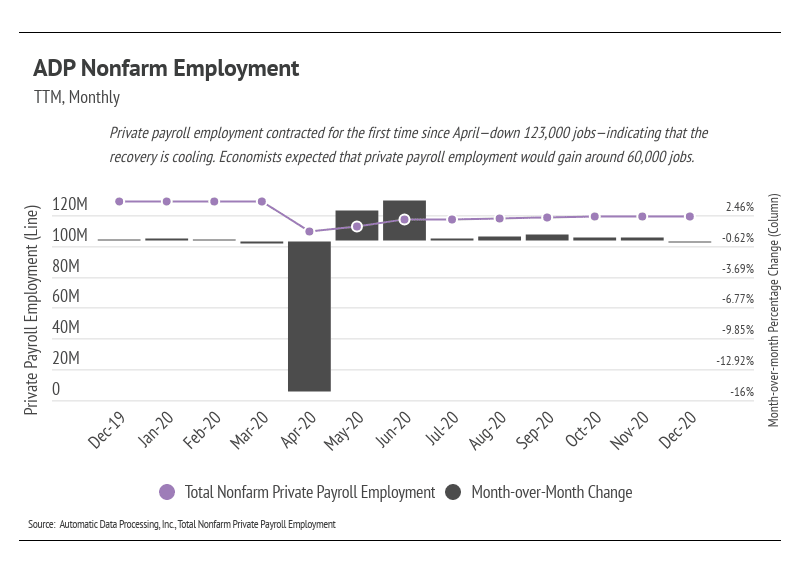
Data from the Bureau of Labor Statistics differs in the exact numbers but shows the obvious deceleration in employment growth. As time passes, more and more jobs will be permanently lost, likely with real long-term economic impact: fewer people interacting in the economy usually indicates less buying, which trickles into less production, which trickles into fewer workers needed, leading to more unemployed workers.
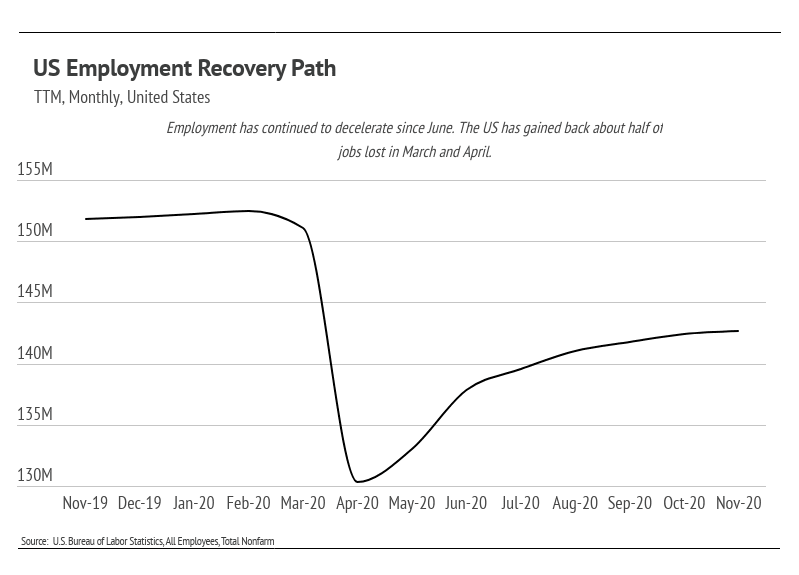
Job growth is one of the clearest indicators of economic health, so the December jobs contraction underscores a slowing of the recovery and the need for government stimulus. Under the incoming presidential administration, government stimulus is far more likely but will take some time to implement. With aid, businesses will be able to continue operating and will likely be able to hire significant numbers of employees back, setting the recovery back on course.
To help struggling businesses and people, the government will have to spend significant amounts of money. Heavy fiscal spending is often associated with higher inflation. Currently, inflation is around 1.2% (the Federal Reserve targets 2%), and with the expected increase in government spending, the expected inflation will rise as well. Ultimately, money today is worth more than money in the future. Not only can you buy more today, but real interest rates (inflation-adjusted interest rates) will be lower as well, making a home bought today cost less than its future price.
For example, the average 30-year mortgage rate is 2.67%, and if the inflation rate were 2%, the real interest rate on the mortgage would be 0.67%.
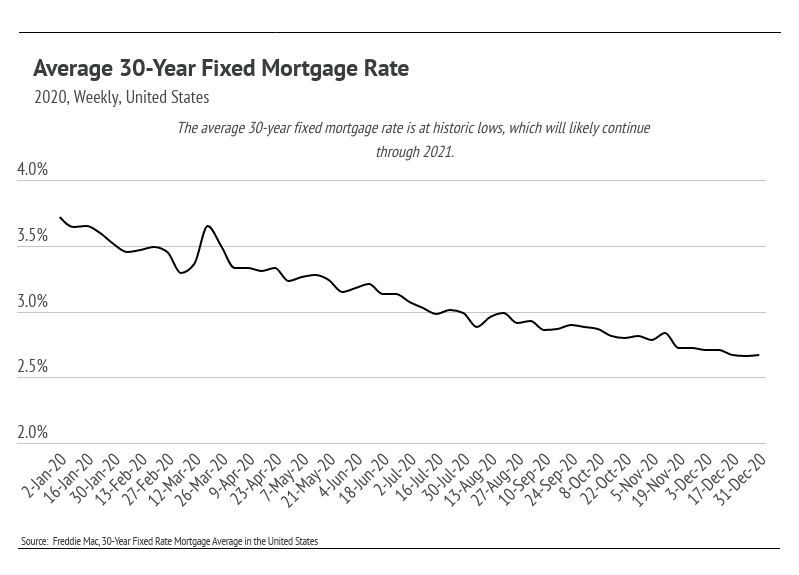
The financial circumstances on the individual level are highly variable, now more than ever. Those who have been unaffected (or even positively affected) financially are likely saving more money than ever. Strict COVID-19 restrictions have largely cut travel, dining, and entertainment expenses, allowing potential home owners to devote more of their income toward buying a home that they love. With historically low mortgage rates and an expected increase in inflation, it’s never been cheaper to finance a home.
Demand shows no sign of decline in the near term. Today, housing is one of the best investments one can make, as it has been historically.
January Housing Market Updates for the North Bay
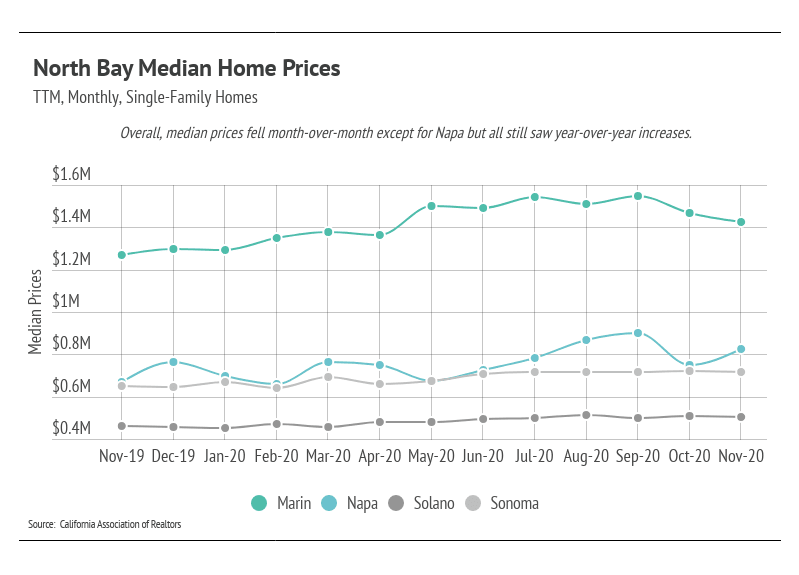
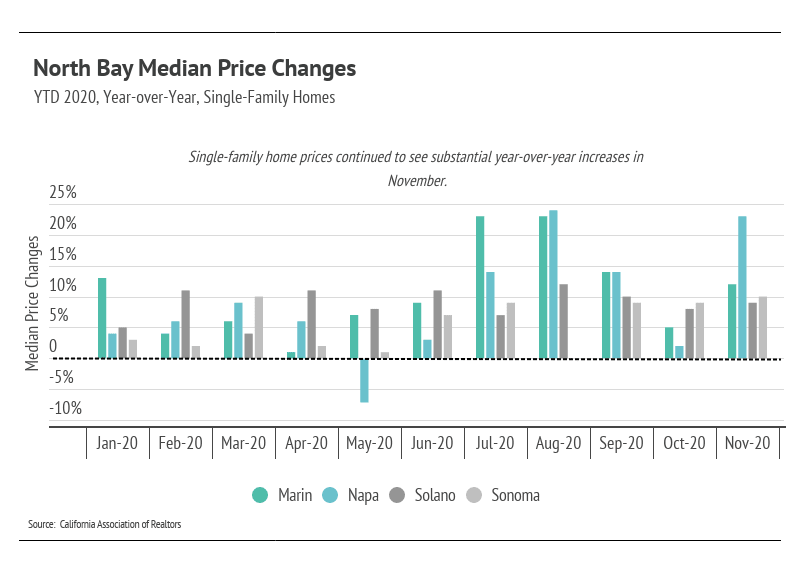
The median single-family home and condo prices fell month-over-month in most counties, which is typical for the autumn/winter season. Year-over-year, single-family home prices have increased considerably as inventory has continued to decline. Fewer homes have come to market, and sales have remained high.
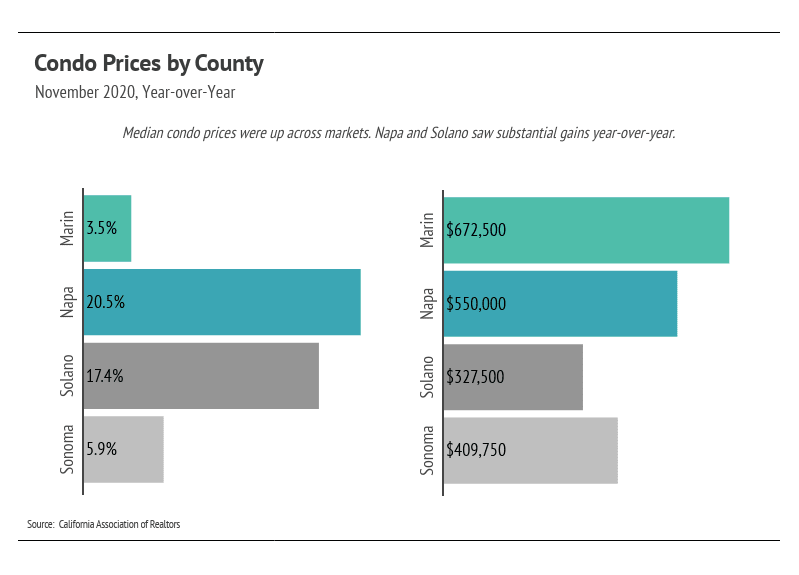
As you can see in the graph below, median condo prices were up across counties. Napa and Solano each had exceptionally large year-over-year median price increases.
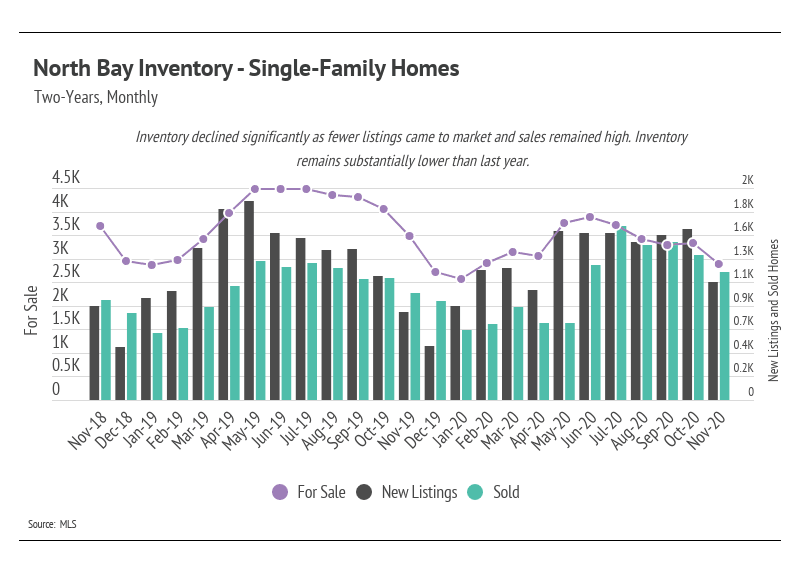
Single-family home inventory was lower through 2020 relative to 2019. Home sales climbed after the initial months of the pandemic (March through May). Generally, buyers and sellers left the market in April and May, causing pent-up demand. Since June, sales have increased and showed unseasonably high levels in November 2020 for both single-family homes and condos. Usually, we expect sales to decline in the autumn and winter months, but homes were selling at extremely high rates. We can attribute this to fewer holiday obligations in 2020, allowing more focus on homebuying. Single-family home inventory dropped in November due to unusually high sales numbers, and it is likely to decline further as we make our way through the winter months.
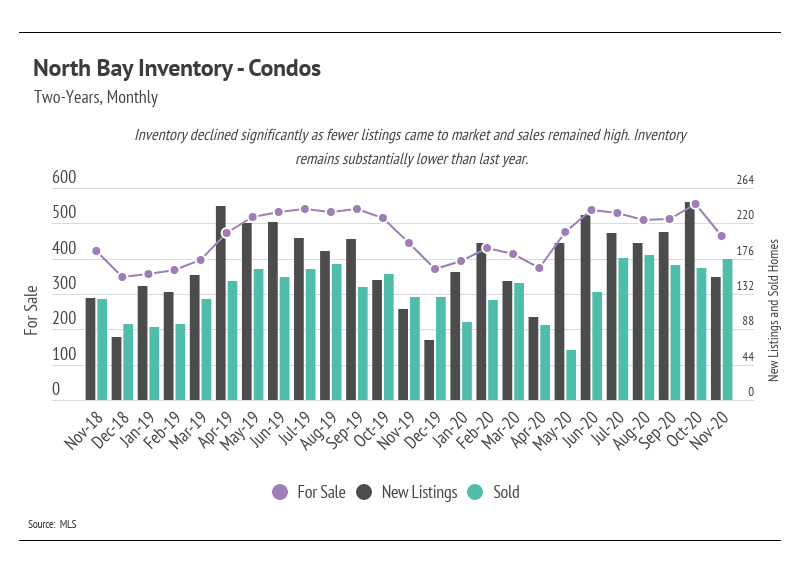
The number of condos on the market declined significantly in November. New condos coming to market outpaced sales every month in 2020 except for November, when sales were far greater than new supply. To emphasize the point, sales in November 2020 were higher than every month of 2019.
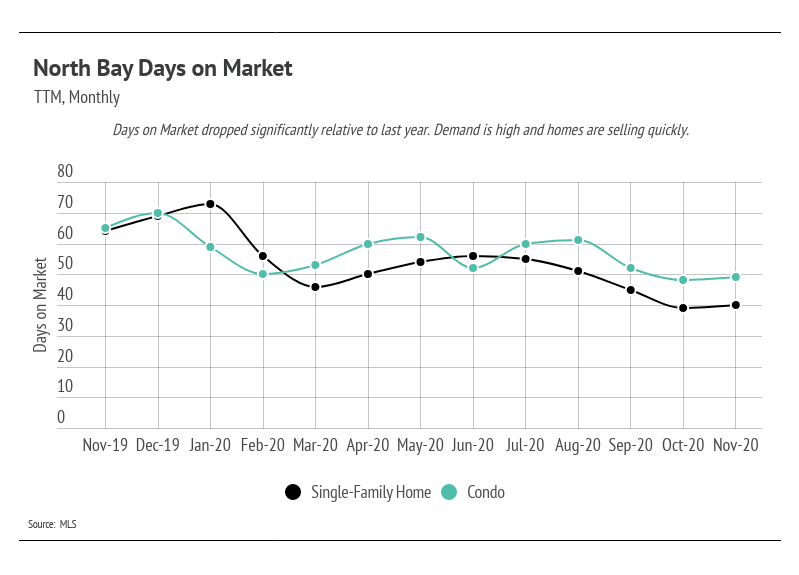
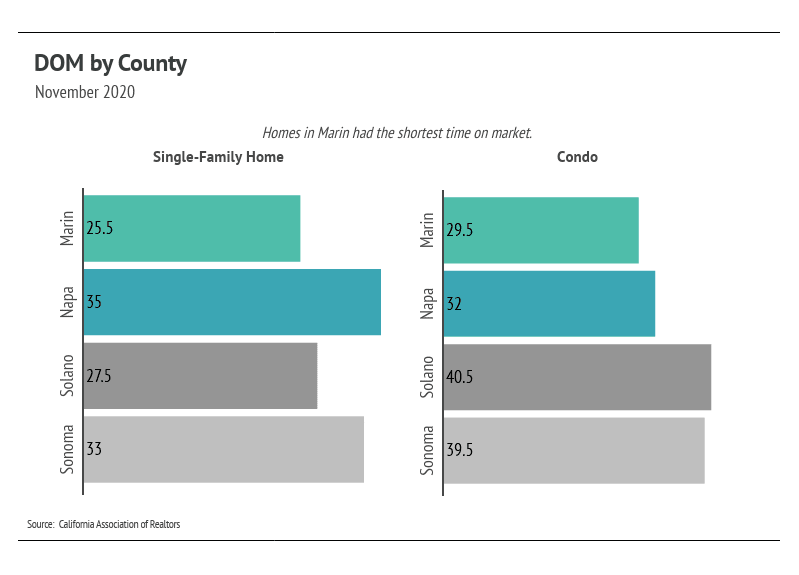
Days on Market (DOM) declined further for single-family homes over the last 12 months, but both single-family homes and condos spent far less time on the market in November 2020 than November 2019. As we will see, the pace of sales affects Months of Supply Inventory (MSI) and has contributed to the low MSI over the past several months.
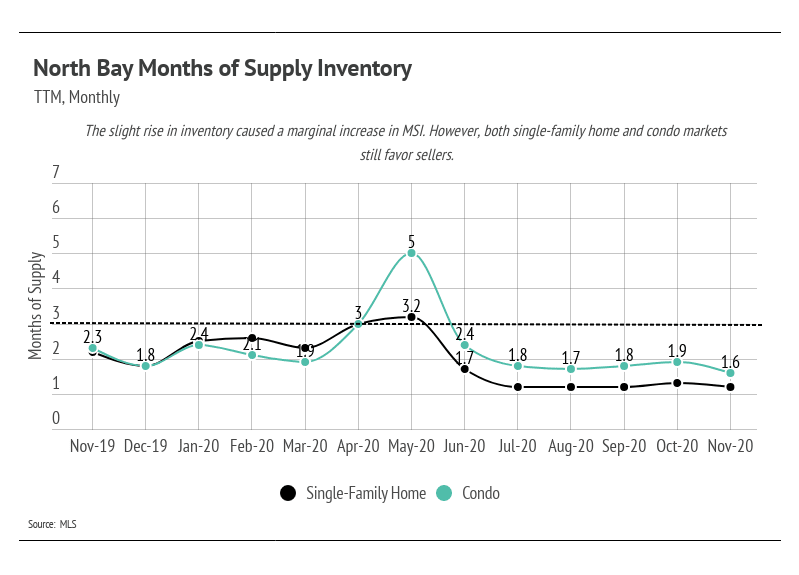
We can use MSI as a metric to judge whether the market favors buyers or sellers. The average MSI is three months in California (far lower than the national average of six months of supply), which indicates a balanced market. An MSI lower than three means that buyers dominate the market and there are relatively few sellers (i.e., it is a sellers’ market), while a higher MSI means there are more sellers than buyers (i.e., it is a buyers’ market). The MSI remained below two for both single-family homes and condos, which favors sellers.
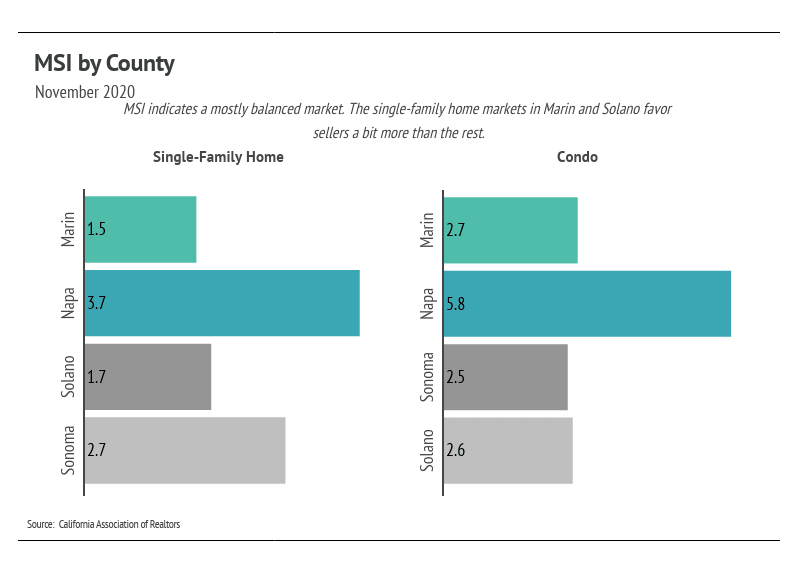
Condos in Napa show a buyers’ market with an MSI of 5.8 months, while the rest of the condo markets are balanced.
In summary, the high demand in the North Bay has sustained home prices. Inventory for single-family homes and condos will likely decline further into the new year, and fewer sellers will likely come to market, potentially lifting prices higher. The condo market is mostly a balanced market between buyers and sellers. Overall, the housing market has shown its resilience through the pandemic and remains one of the safest asset classes. The data show that housing has remained consistently strong through this period.
The autumn/winter season tends to see a slowdown in activity, although we saw a new trend toward the end of 2020 with higher-than-normal sales.
As always, we remain committed to helping our clients achieve their current and future real estate goals. Our team of experienced professionals are happy to discuss the information we’ve shared in this newsletter. We welcome you to contact us with any questions about the current market or to request an evaluation of your home or condo.
Stay up to date on the latest real estate trends.









You’ve got questions and we can’t wait to answer them.